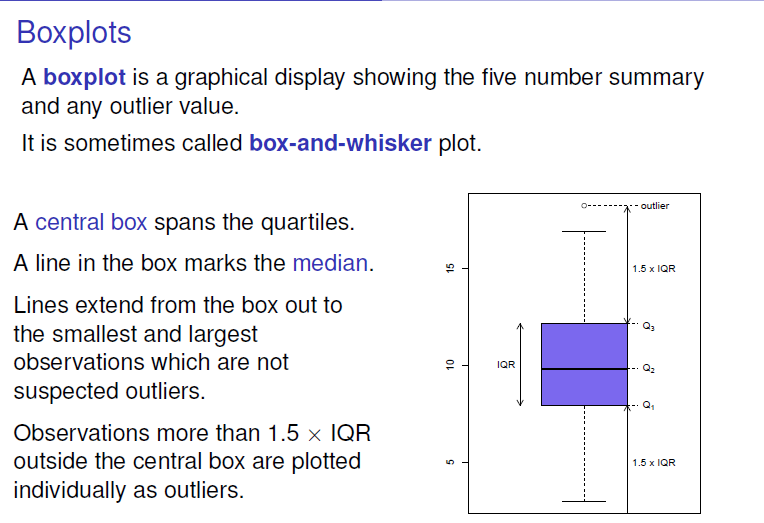
Boxplots

Tuesday, 2 July 2019

12:43 PM

Boxplots 
A boxplot is a graphical display showing the five number summary 
and any outlier value. 
It is sometimes called box-and-whisker plot. 
A central box spans the quartiles. 
A line in the box marks the median. 
Lines extend from the box out to 
the smallest and largest 
observations which are not 
suspected outliers. 
Observations more than I .5 x IOR 
outside the central box are plotted 
individually as outliers.


Created with Microsoft OneNote 2016.