Maple1131W8T5 - Plotting
Saturday, 21 April 2018
11:24 AM
Created with Microsoft OneNote 2016.
![Untitled picture.png Machine generated alternative text:
corresponding value of y.
[CO., 36.1],
[1.20, 70.2],
[1.20, 99.1],
[3. , 129.],
236.]'
[10.6, 239.] ,
[12.2, mo.], [13.4, 237.] ,
[16.6,
135.]'
[20.4, Ill.],
[24.6, 79.9],
[22.2, 48.9],
[23.4,
-259.]'
[33. ,
-310.], [34.2,
-391.] ,
[35.6, -449.] , [33.6, -501.]'
The following set of data points was collected during an experiement. The first coordinate of a data point is the value of x , and the second coordinate of the data point is the
[3.20, 151.] ,
[7.80, 175.], [6.40, 191.] ,
232.]'
[16.2, 224.] ,
[18.8, 211.] ,
[18.2,
11.1],
[25.2, -21.9],
[25.8, -59.1],
[28.4, -120.] ,
[28.6, -160.]'
[35.2, -580.] ,
[35.4, -651.] ,
-720.] , [40.8, -800.] ,
[9.20, 2€8.],
[9.80, 220.] ,
[10. , 231.] ,
[10.8,
198.]'
[17.6, 180.] ,
[18.6, 159.]'
[21.4,
[31. -211.]'
[30.2,
[39.2, -880.]]
Use Maple to plot the data points and choose the correct answer for each of the response areas.
The quantity y is approximatly
O int.
neither increasing nor decreasing '
Approximately, the relationship between the two variables is
not linear
Untitled picture.png Machine generated alternative text:
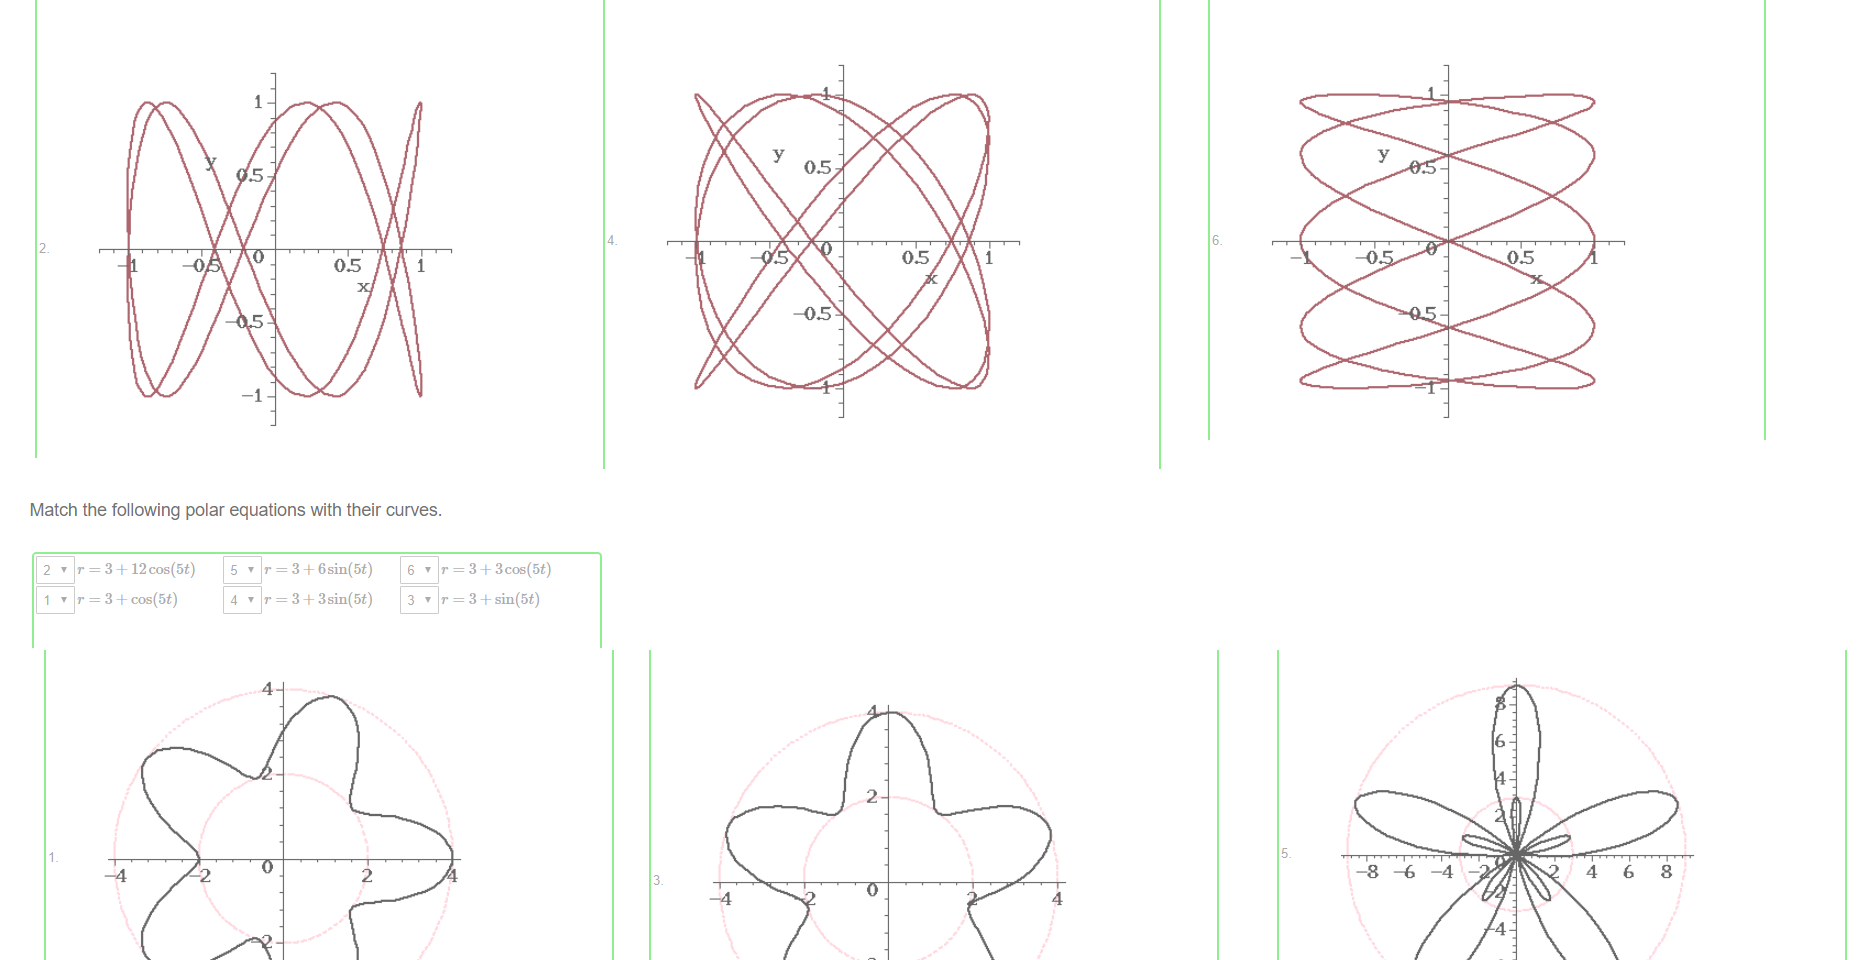
Match the following parametric equations with their curves.
y = sin(4t).
y = sin(5t).
= sin(2t).
= sin(5t +- 77/6).
= sin(4t),
y = sin(5t).
= sin(2t),
y = sin(5t -f- 77/6).
Untitled picture.png Machine generated alternative text:
os
Untitled picture.png Machine generated alternative text:
Untitled picture.png Machine generated alternative text:
os](Maple1131W8T5%20-%20Plotting_files/image001.png)