Phasor Diagram
Monday, 17 September 2018
1:40 PM
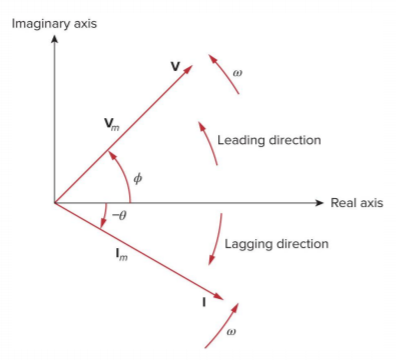
A phasor can be expressed as a vector, with a magnitude and a phase (direction)
Phasor diagrams can be plotted on a Cartesian plane, where frequency
is equal and constant.
Phasor diagrams are also known as the frequency domain
- Angle/Phase is measured from the positive real axis, going counter-clockwise
- The leading phasor is the one ahead of the other phases in the counter-clockwise direction