Identifying Performance Bottlenecks
Contents
Bottlenecks are limitations in the flow of data that can prevent the logic blocks from working at their maximum data rate.
Such limitations in the data flow can come from a number of sources, for example, I/O ports and arrays implemented as block RAM. In both cases, the finite number of ports (on the I/O or block RAM) limits the rate at which data can be read or written.
Another source of bottlenecks is data dependencies in the original source code. In some cases, these data dependencies are inherent in how the algorithm operates, as when a calculation cannot be performed until an earlier calculation has completed. Sometimes, however, the use of an optimization directive or a minor change to the C code can remove them.
The first task is to identify such issues in the RTL design.
- Start with the largest latency or interval in the Module Hierarchy report and navigate down the hierarchy to find the source of any large latency or interval.
- Click the Resource Profile to examine I/O and memory usage.
- Use the graphical viewer and look for patterns in the Schedule Viewer which indicate a limitation in data flow
- You can use the Analysis perspective to identify such places in the design quickly
Example of the Block RAM being used in multiple states, likely bottlenecking
If a resource is active in multiple states, the resource is being reused in different clock cycles

Block RAM read operations often take 2 cycles
- Generate the Block RAM address
- Read the value from the address
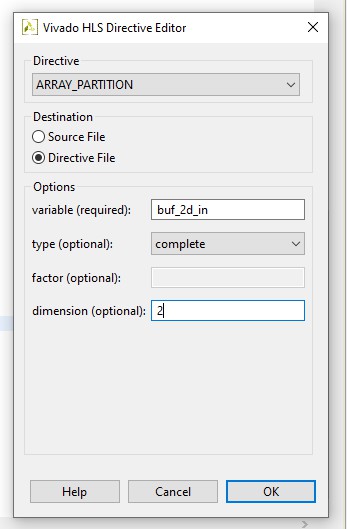
We should perform array partitioning
Example of Locating the Bottleneck Function
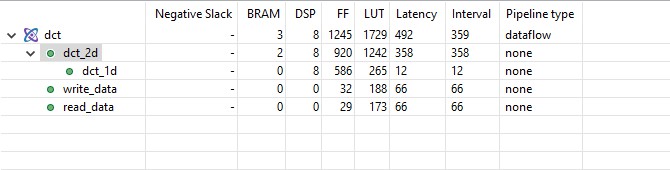
We can see that dct is performing its sub functions in parallel, as its interval is less then the sum of its sub functions' latencies.
We see that dct_2d has almost the same interval value as dct, so it is likely the bottleneck.
We could potentially pipeline that function, but it would unroll all the loops which may lead to a large area increase.
Instead we could try promote to loops to the top-level by inlining where they'll be dataflow optimised
Loop Tripcount
NOTE: The
TRIPCOUNTpragma is for analysis only, and does not impact the results of synthesis.
The TRIPCOUNT pragma can be applied to a loop to manually specify the total number of iterations performed by a loop.
Vivado HLS reports the total latency of each loop, which is the number of clock cycles to execute all iterations of the loop. The loop latency is therefore a function of the number of loop iterations, or tripcount.
Source: https://docs.xilinx.com/r/en-US/ug1399-vitis-hls/pragma-HLS-loop_tripcount